

How do I change my dashboard and add a widget?
- Manager v3
- Administrator
In short. Dashboard › “Edit”: reorder the cards, change their width, configure them or add a widget (“Add widget”). The dashboard menu creates, edits, duplicates or shares a dashboard. Reserved to the administrator.
Each card of the dashboard is a widget: a figure or a chart drawn from your data. You choose which ones you see, and you can create more.
Changing a dashboard is reserved to the administrator. An agency manager can do it only if the company turned on “Dashboard editable by the agency managers” in its settings, and for a dashboard whose agencies are all theirs. Managing access and deleting stay with the administrator.
Rearrange the widgets
Click “Edit”
At the top of the dashboard. The banner says: “Edit mode — drag a card to reorder it, its right edge to resize, configure or remove each widget.”
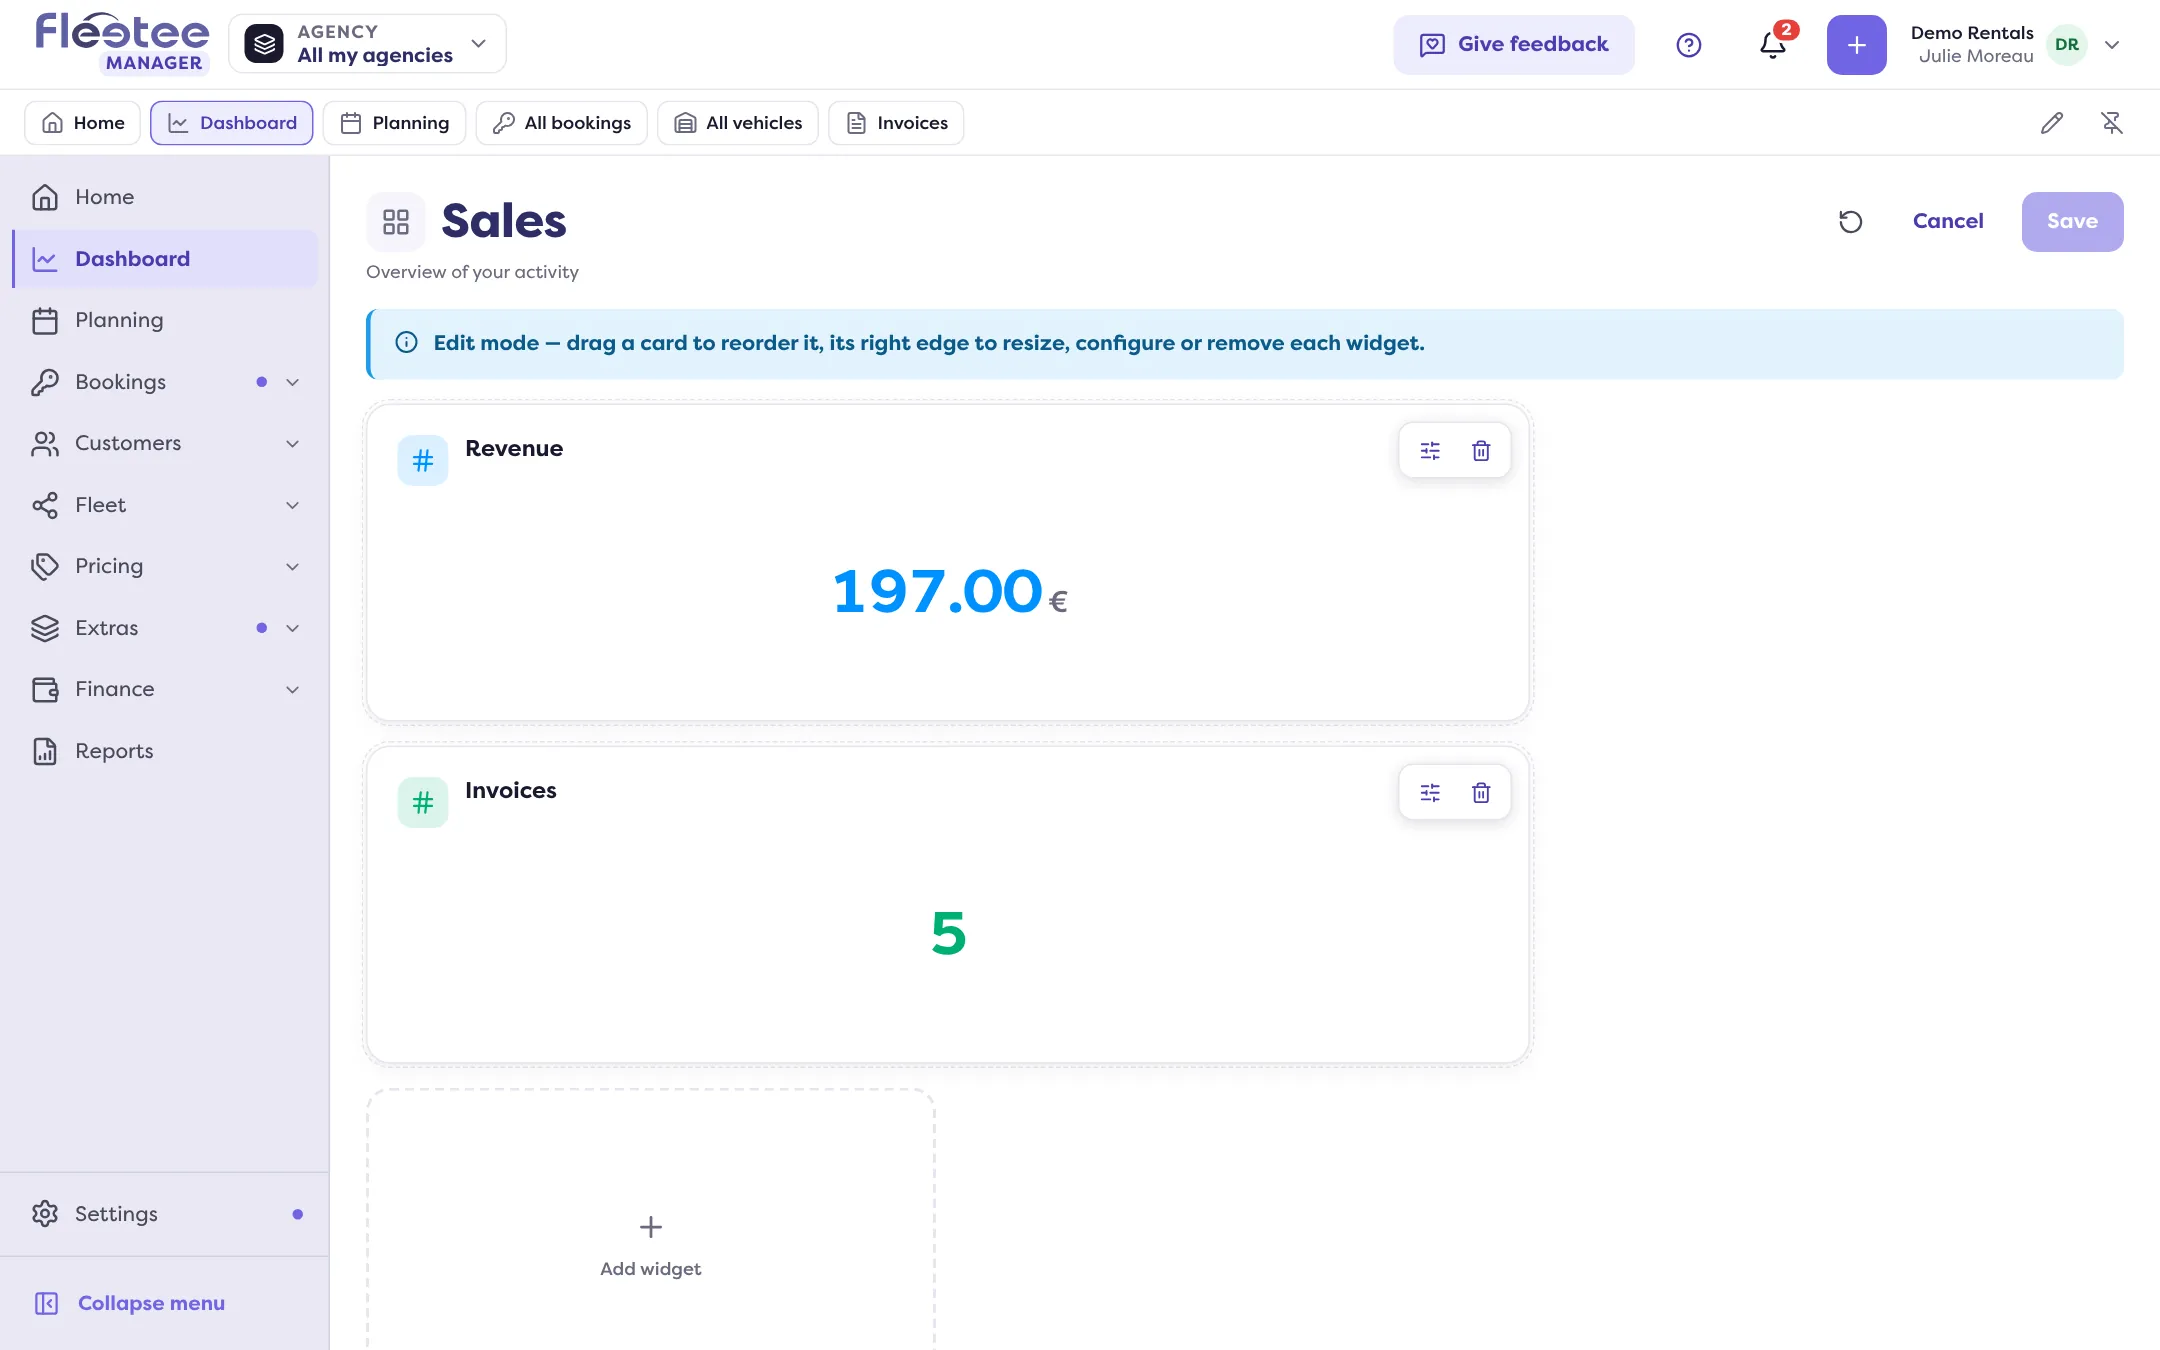
Adjust the cards
Drag a card to move it. “Resize width”: drag its right edge. “Configure” opens its settings; “Remove widget” takes it off.
Click “Save”
“Dashboard saved.”
Add a widget
In edit mode, click “Add widget”
The cell is at the end of the grid. The “New widget” panel has two steps: Data then Appearance.
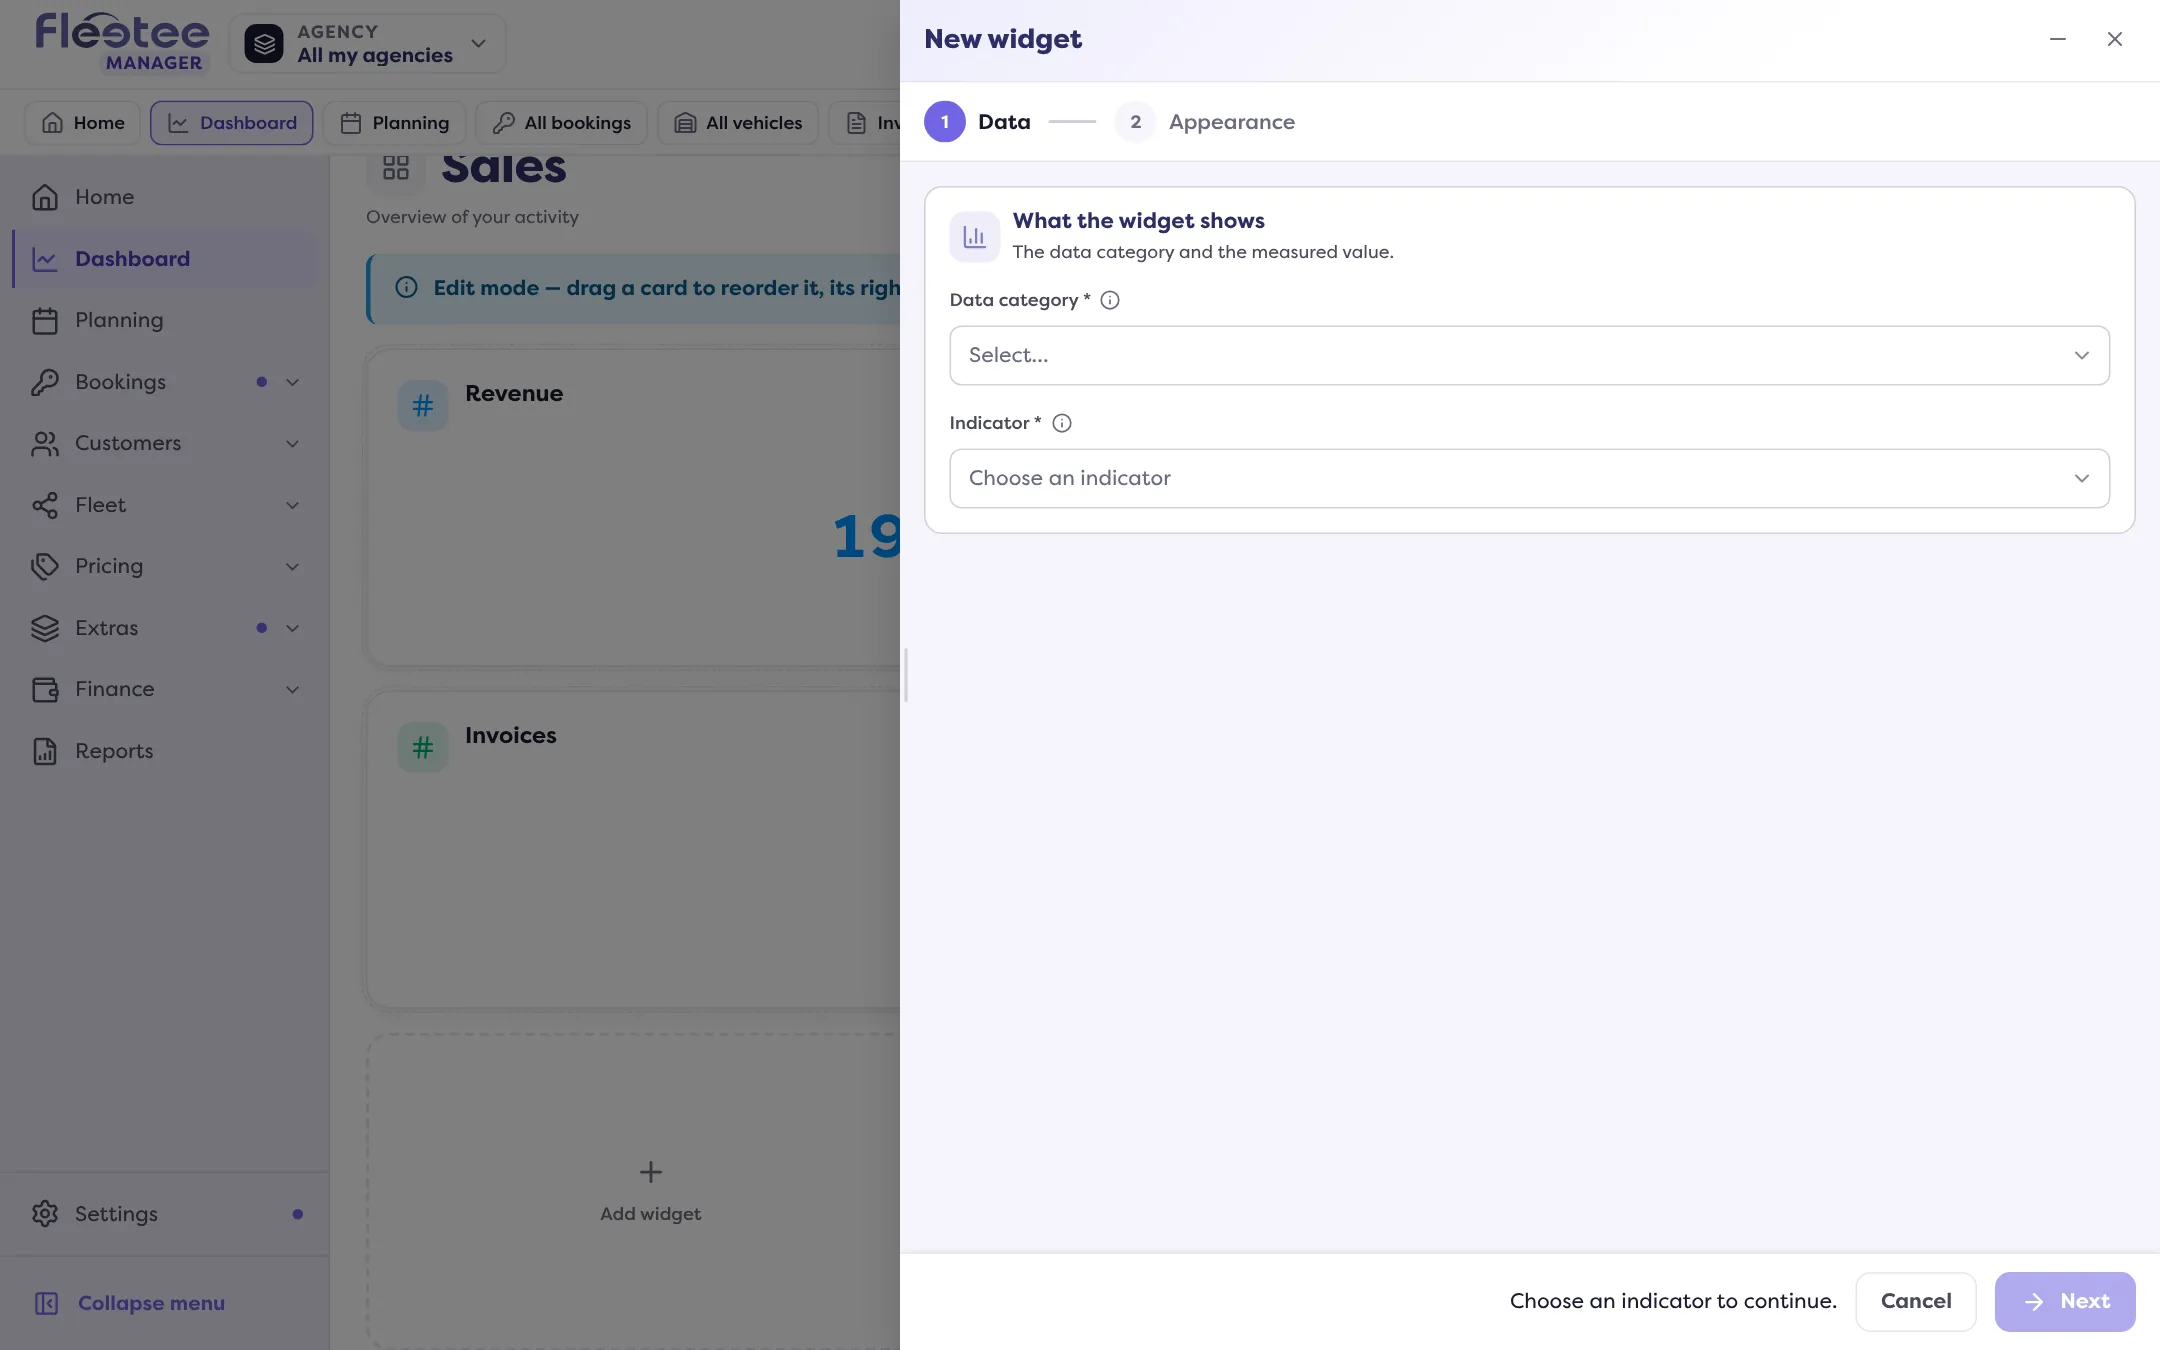
“Data” step: choose what the widget measures
“Data category” (the type of data analysed), then “Indicator” (the measured value: see What do the rotation rate and the other indicators mean?). “Based on the date of… to the date of…” picks the dates that place each item in the period shown. “Status” restricts the calculation to certain statuses; by default, all are included.
“Appearance” step: name and draw
“Title” (required, for example “Monthly rentals”) and “Description”. “Chart type”: Number, Bar chart, Line, Pie, Radial bar or Radar. “Decimals”. “Segmentation”: No segmentation, or by Agency, Category or Source. “Scope”: Over the period or Over all data.
Save
“Widget added.” An existing widget is changed with “Configure” (“Widget updated”).
The period and the rhythm of the figures
The period, the comparison and the filters are set at the top of the dashboard, outside edit mode (see What does the dashboard show?). For the rhythm of one card’s figures, its menu offers “Time split” (administrator): Automatic, Daily, Weekly, Monthly or Yearly.
Change the default filters, or create other dashboards
The dashboard’s actions menu offers:
- “New dashboard”: you can have several; a switcher on the page title moves between them. The wizard has four steps: General (title, description, export format), Appearance (icon, colour, chart palette), Access and Default filters.
- “Edit dashboard”: the same steps. Default filters sets the period and the scope (agencies, vehicle type, category, source) shown when it opens.
- “Duplicate dashboard”: “Dashboard duplicated”, with the same widgets and settings.
- “Manage access”: the agencies that see the dashboard; empty, it is private.
- “Delete dashboard”: final.
Where to find it: Dashboard › “Edit” › “Add widget”
Where to find it: Dashboard › “Edit” › “Add widget”
Go further
Updated on 18 November 2026 with version 3.0