

What does the dashboard show?
- Manager v3
- Administrator
- Agency manager
In short. The Dashboard gives your indicators by period and agency (revenue, bookings, utilisation rate, average price…), with comparison and filters. The administrator chooses the cards shown.
The dashboard is open to the administrator and the agency managers.
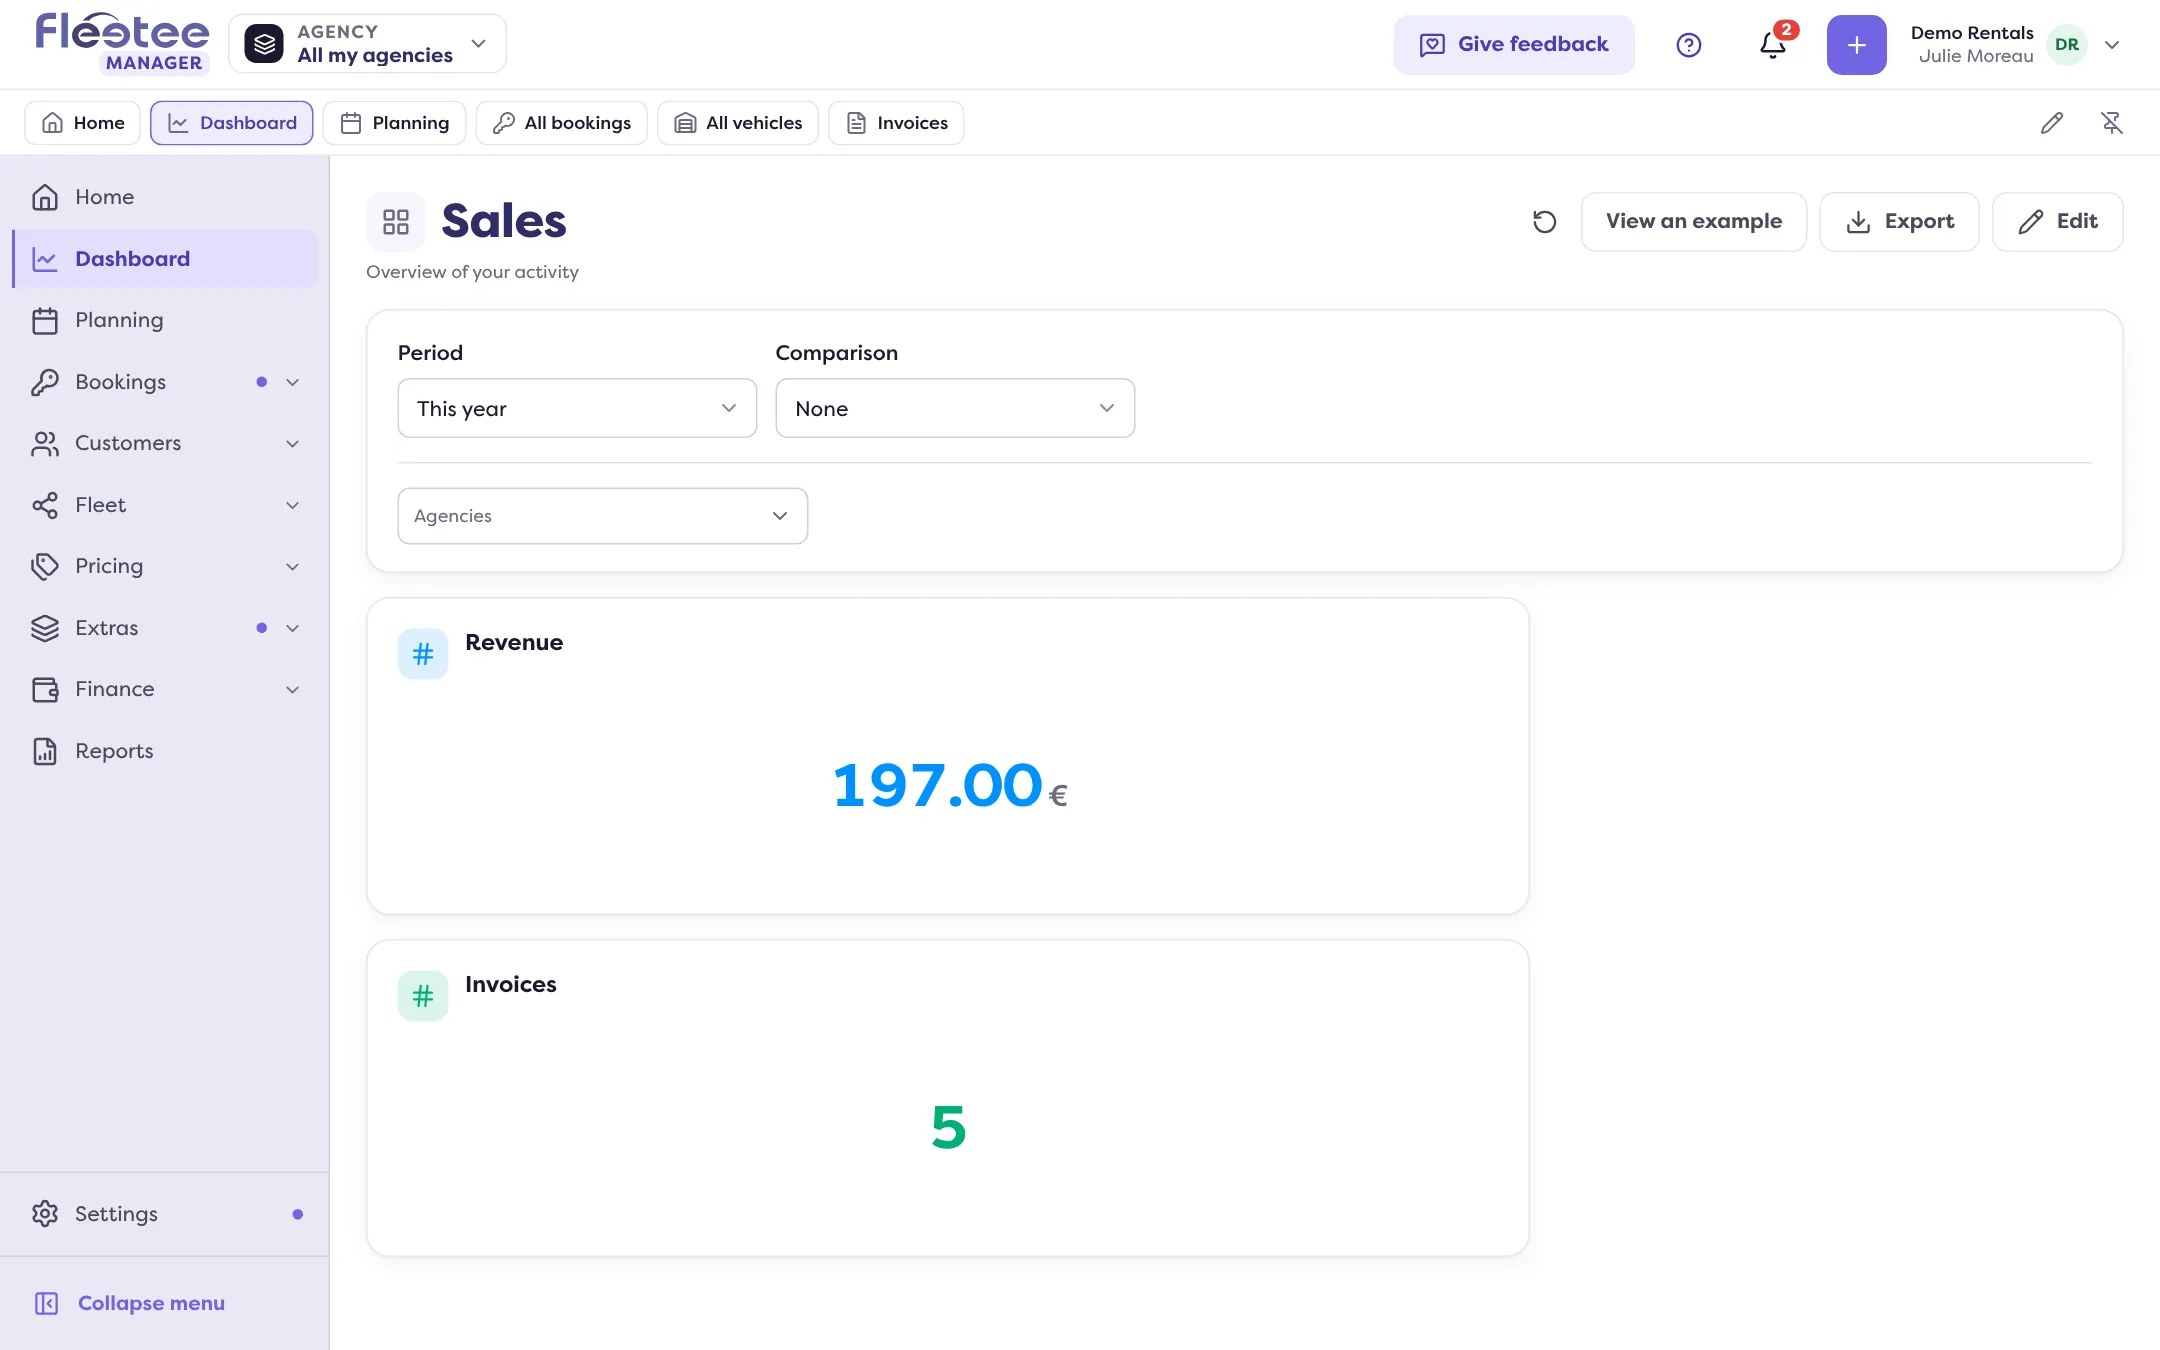
The Dashboard answers “how is my business doing?”: cards of figures and charts, over the period and agencies of your choice. It opens from the Dashboard menu (and its pinned tab bar).
Choose what you look at
- Period: Today, Yesterday, Last 7 or 30 days, This month, Last month, Last 3 or 12 months, This year, Last year, Next 3 or 6 months, or Custom.
- Comparison: None, Previous period, Previous year, or a period or a year you choose. The cards then show the gap and a marker for the compared period.
- Filters: Agencies, Vehicle type, Category and Source (the booking channel).
The default cards
- Business volume: business volume incl. VAT, based on the rental start date.
- Revenue: revenue excl. VAT, based on invoicing.
- Number of bookings: based on the booking creation date; Bookings: based on the rental start date.
- Utilisation rate: booked days divided by available days.
- Rentals / Category, Business volume / Category, Revenue / Category: the breakdown by category.
- Average price per day, Average duration, Rental days, Rentals in progress, Booking channels.
- Optional products (options, packages…) and Business volume excl. options.
Each card offers “Export data”, “Download image”, “Expand”, “View elements” (the rows behind the figure) and, for an administrator, a “Time split”.
Customise
An administrator opens the dashboard’s actions menu: “Edit” (reorder cards by dragging, change their width, configure or remove them), “New dashboard”, “Duplicate dashboard” or “Manage access”. A dashboard can be shared with agencies: the banner says “Dashboard shared with N agencies”.
Are the figures up to date?
A line at the bottom says “Figures up to date: every change is taken into account”, or how many changes are still waiting. “Learn more” opens the Synchronization log: the items waiting (invoices, bookings, payments, claims…) and their state. You cannot trigger anything from it: if a figure still looks wrong after a reasonable delay, contact support. Items synced for more than 30 days are removed from it.
Where to find it: Dashboard
Where to find it: Dashboard
Go further
Updated on 18 November 2026 with version 3.0